

Velocity in Pipeline Formula and How to Lift It
Velocity in Pipeline Formula and How to Lift It

Velocity in pipeline is (open opportunities × average deal value × win rate) ÷ sales-cycle days. With 100 opportunities worth $20,000 each, a 25% win rate and a 100-day cycle, that equals $5,000 in expected revenue per day.
That figure isn't a trophy for a large pipeline. It's a diagnostic: if more deals come with weaker qualification or longer delays, the reading can fall. Clear dormant opportunities and velocity can rise without adding a single name.
Table of Contents
Velocity in Pipeline in One Formula
Velocity in pipeline estimates the value of revenue generated per day from qualified opportunities that are open. The formula multiplies the number of open opportunities by average deal value and win rate, then divides the result by sales-cycle days. The sales pipeline metrics definition from Prospeo presents this as a revenue-throughput measure, not a simple count of prospects.
For a base case, 100 opportunities × $20,000 × 25%, divided by 100 days, produces $5,000 per day. The table shows how changing one input affects the result, and why adding names doesn't guarantee faster revenue.
| Scenario | Open opportunities | Average deal value | Win rate | Cycle days | Expected revenue per day |
|---|---|---|---|---|---|
| Base case | 100 | $20,000 | 25% | 100 | $5,000 |
| Win rate up 10% (relative) | 100 | $20,000 | 27.5% | 100 | $5,500 |
| Deal value up 10% | 100 | $22,000 | 25% | 100 | $5,500 |
| Cycle 10% shorter | 100 | $20,000 | 25% | 90 | About $5,556 |
| More deals, weaker quality | 150 | $20,000 | 15% | 120 | $3,750 |
The win-rate row is a 10% relative increase, from 25% to 27.5%, not an increase of ten percentage points. The deal-value row also lifts velocity by 10%. Cutting cycle length from 100 days to 90 raises the result by about 11.1%, because cycle days sit in the denominator.
The last row is the warning. A bigger list can mean slower money. More opportunities only help if their quality and movement through the pipeline hold up.
Build a useful comparison
Use the formula as a trend, split by segment, source, territory or salesperson, rather than treating one company-wide figure as a universal benchmark. A blended number can move because the deals changed, because stage rules changed, or because your team started counting opportunities differently.
Before interpreting a new reading, replace the table's base case with the four corresponding figures from the CRM: qualified open opportunities, realistic average value, win rate and sales-cycle days. Keep the definitions consistent between periods. Then look for which input changed, instead of congratulating the team on a higher total opportunity count.
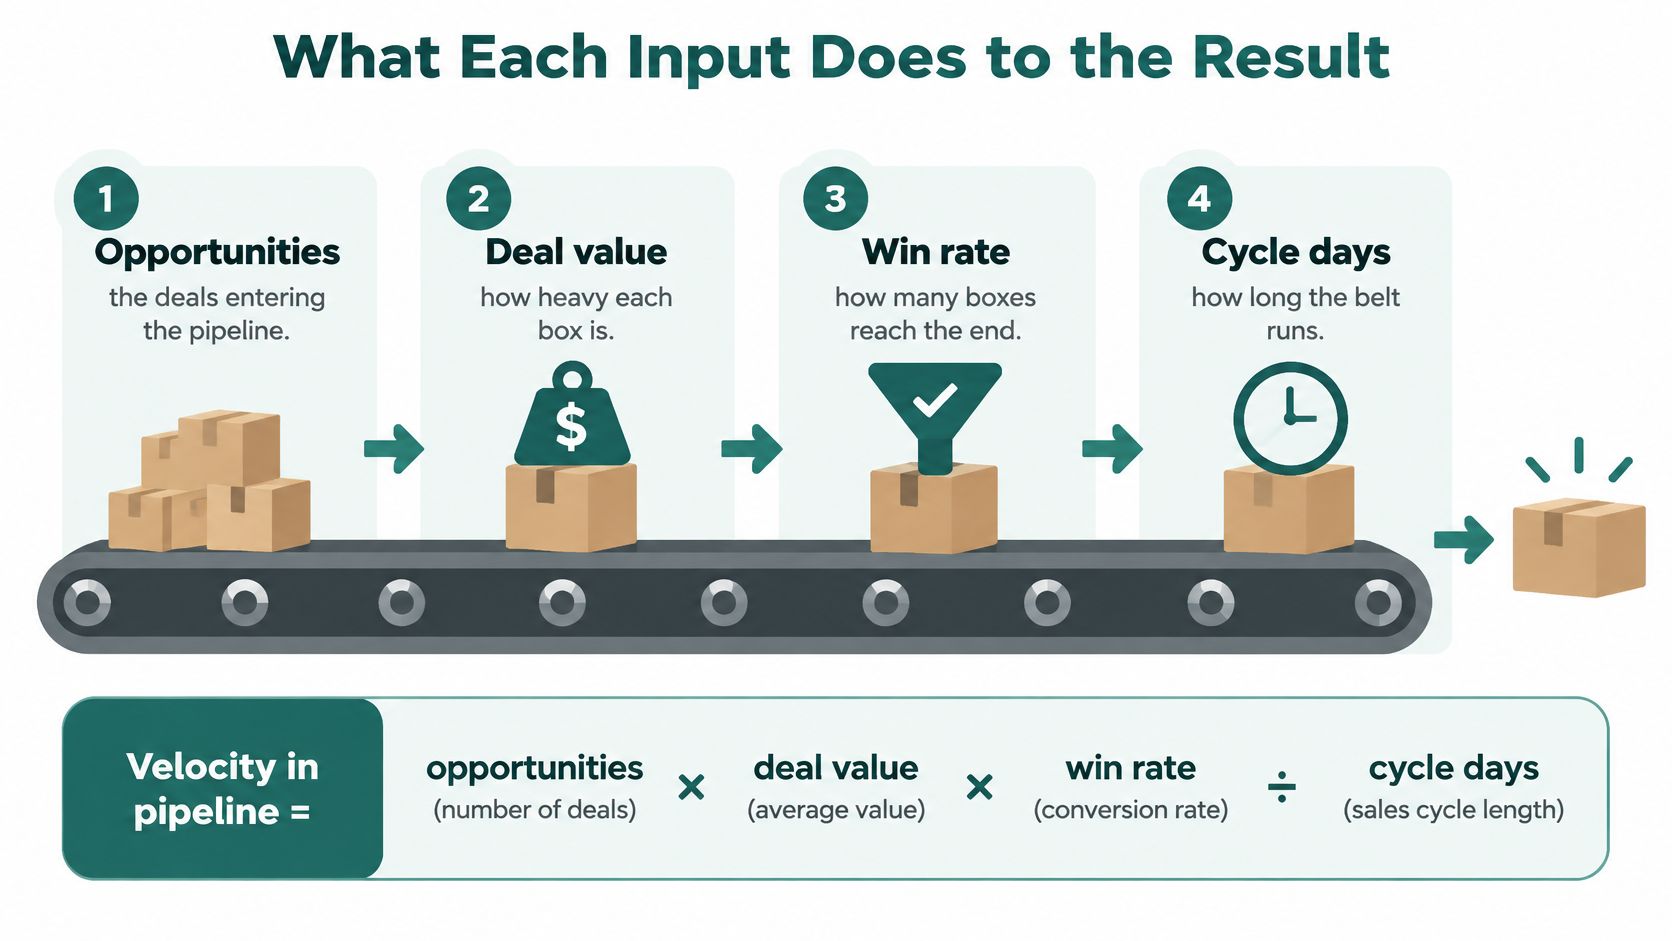
What Each Input Does to the Result
Think of the formula as a conveyor belt. Opportunities are the boxes, deal value is their weight, win rate is how many reach the end, and cycle days measure how long the belt runs.
The conveyor moves revenue only when qualified boxes reach the end at a credible value and pace.
Pull the right fields from your CRM
Open opportunities means deals that meet the team's qualification criteria and are still active. It doesn't mean every company in a saved list, every contact, or every lead that once replied. If the CRM count includes unqualified prospects, the formula rewards clutter.
Average deal value should reflect the amount the team realistically expects to invoice. Don't use an optimistic first quote if scope, discounting or buyer approval usually changes the number. Padding value makes the score look better, but it doesn't create cash.
Win rate is closed-won outcomes divided by decided outcomes over a recent, consistent period. Keep it split by segment. A blended rate can hide a weak segment that wins rarely, even when another segment performs well.
Sales-cycle days should run from the qualified opportunity's creation date to its close. A few very old deals can distort an average, so check the median as well. Open opportunities haven't completed their journey. Treating them as if they had can make the cycle look shorter than it is.
Win rate and deal value change velocity in proportion to their movement. Cycle length works in reverse: reduce the denominator, and the result rises by a slightly larger share for the same percentage change. Don't shorten the clock by rushing buyers. Remove avoidable delay and measure whether deals still close.
Beside the report, write four questions: How many qualified opportunities are open? What is their realistic value? What is the recent win rate? How many days does a decision take?
Why Intent Beats a Bigger Pipeline
A larger pipeline can produce a lower velocity reading. Add opportunities with weak buying signals or long periods of silence, and the count grows while progress slows. Measure velocity by segment, not just across the whole pipeline.
Ebsta's 2024 benchmark found that high-intent accounts closed at 3.4 times the velocity of other accounts, according to Ebsta's 2024 B2B Sales Benchmarks. The same benchmark reported a 488% velocity improvement for its best-performing seller personas. Treat these results as evidence that intent and execution matter, not as targets your team is guaranteed to reach.
| Finding | Figure | What it means for you |
|---|---|---|
| High-intent accounts versus other accounts, 2024 | 3.4 times the velocity | Rank accounts by intent before adding names |
| Best-performing seller personas, 2024 | 488% velocity improvement | Review how your team qualifies and progresses deals |
| Study scale, 2024 | 4.2 million opportunities, 530 companies, over $54 billion | The findings span multiple organisations |
| Opportunities per salesperson per quarter, 2022 | 49, only 3% fewer than in 2021 | Qualification matters when workload stays broadly flat |
The operator's choice is clear: improve the quality of opportunities before increasing their number. A stale deal still counted as active can drag down a segment's velocity. Clearing it from the pipeline can raise the reading without adding a single prospect.
Use evidence of a possible need to decide which accounts deserve attention. A hiring announcement, new appointment, company news, public request for help or open tender can give you a reason to approach a company. It is a prioritisation clue, not proof that a deal will close.
Use signal-first prospecting to organise prospects around the evidence and its date. Then compare progress and conversion for that segment with other sources. Keep the benchmark's 3.4-times result in perspective: your own segment results should guide your decisions.
When One Company Number Misleads You
The same formula can rise while a pipeline gets less healthy. A larger opportunity count can hide poor qualification, quieter buyers or inflated deal values, so the total alone doesn't tell you whether the business is improving.
A single sales-cycle target is especially misleading when deal sizes differ. MarketSplash's coverage of B2B sales statistics reports 2025 average cycles of 1.9 months for deals below $25,000 and 8.9 months for deals above $500,000.
| Segment | Reported average cycle | Risk if you blend it |
|---|---|---|
| Deals below $25,000 | 1.9 months | Fast closes make the whole company look quicker than it is |
| Deals above $500,000 | 8.9 months | Long buying committees distort a small-deal team's target |
A founder selling a small monthly service and a team selling a six-figure annual contract shouldn't share one velocity target. Geography, contract size and the number of people involved in a purchase all shape the route to a decision. Keep those segments separate, or the faster deals can make the slower team look worse than it is, and vice versa.
Treat stalls as a pipeline condition
The sales pipeline management guide from Terasu reports that 89% of buyers experienced stalled deals in the preceding year, while only 45% of sales leaders and sellers had high confidence in forecast accuracy. The same guide reports that only 14% of sellers drive more than 80% of new revenue. A company-wide average can therefore conceal both stale deals and a heavy reliance on a small part of the team.
A blunt average cycle hides deals that are still open, dormant opportunities left in active stages, and different stall risks across segments. Replace the single clock with four views:
- Signal to first action: median time from the evidence of need to a meaningful response.
- Buyer milestones: time between buyer-confirmed steps, rather than internal activity alone.
- Reactivation: whether quiet opportunities show a credible reason to restart.
- Opportunity state: velocity split across new, engaged, dormant and recycled deals.
Clear or recycle dormant deals when they no longer reflect a live buying process. That can raise the velocity reading without adding a single name, because the pipeline now describes the deals the team can work.
Which part of velocity changed, and was it the buyer or the way stages are kept in the CRM?
Activity counts won't answer that. Check stage dwell time, buyer actions and source dates before deciding that sellers need to move faster.
UK Rules for Cold Email Before You Send
Before you send a UK marketing email, classify the recipient. Under the Privacy and Electronic Communications Regulations (PECR), marketing email to limited companies and other corporate subscribers does not require consent. Data-protection rules still apply if you use a named employee's email address or other personal data. The Information Commissioner's Office guidance on electronic mail marketing explains the distinction.
Sole traders and some partnerships count as individual subscribers. Unsolicited marketing email to them generally needs prior consent or a valid soft opt-in. The ICO describes the soft opt-in as a narrow exception for existing customer relationships. It applies only when you collected the details during a sale or negotiation, the marketing concerns similar products or services, you offered an opt-out at collection, and every later message includes one.
Consent must be freely given, specific, informed and unambiguous. The recipient must be able to withdraw it as easily as they gave it. Every marketing message must identify the sender and provide a way to opt out. Follow the ICO's business-to-business marketing guidance.
A hiring announcement, tender or public request for help may show a possible need. It does not grant permission to email someone. Verifying an address can help you avoid contact errors, but it does not establish a lawful basis for using personal data or sending marketing. Use email address verification to check contact details, then review the ICO's data-protection guidance for direct marketing for your separate compliance duties.
Before sending, record the recipient type and, where relevant, your basis for using personal data. Identify your business and include an opt-out route. SignalVan drafts messages for your review; you control campaign approval and sending through your connected Smartlead account.
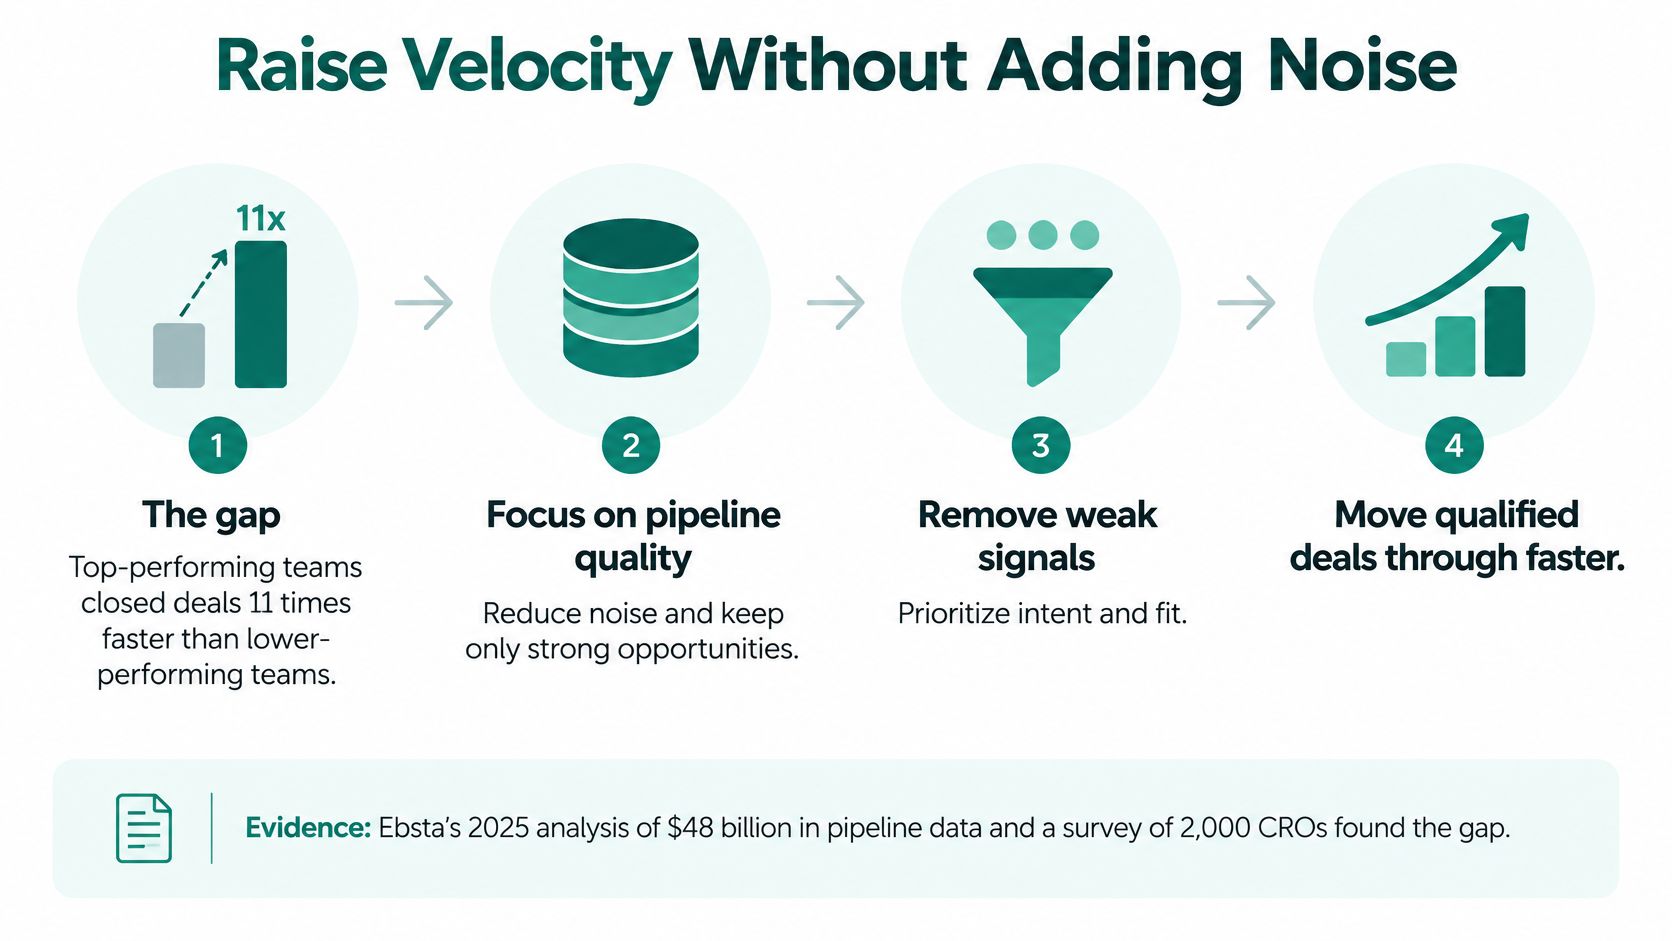
Raise Velocity Without Adding Noise
Ebsta's 2025 analysis of $48 billion in pipeline data and a survey of 2,000 CROs found that top-performing sales teams closed deals 11 times faster than lower-performing teams, according to Ebsta's 2025 GTM Benchmarks announcement. That's a gap between groups, not a result any process guarantees. Use it as a reason to inspect the system, not as a forecast.
A six-step operating routine
Choose a narrow comparison. Pick one segment, one offer and one country. Calculate velocity for the last two quarters, split by source. A narrow cut makes it easier to tell whether the difference comes from account quality, deal size or how the team works the segment.
Clean the open pipeline. Close or recycle opportunities with no buyer action beyond that segment's normal stage dwell time. Recalculate using the cleaner count. Don't let an inactive record inflate the number of deals the team claims to be pursuing.
Start with a dated reason to approach. Hiring, funding, a new role, a public request for help, company news and open tenders can all signal a possible need. Signal-first prospecting begins with a reason and a date, not a purchased list. Paying customers are more likely to come from a live reason to buy than from pressure on a quiet stage, but the signal still needs to be tested against actual outcomes.
Check freshness and contact details. Confirm that the signal is still current and that the relevant outreach rules are met. Use a verified email for the decision-maker, and put the reason for the timing near the start of the draft. Keep the signal source and date on the lead record so the team can check what prompted the approach.
Keep approval and sending with the user. Edit and approve each message, then send it through the team's own Smartlead account. SignalVan works with Smartlead as its outreach tool, and campaigns are built in the customer's own account. Nothing is sent automatically. SignalVan's workflow keeps prospect discovery, message drafting and the user's sending decision distinct.
Wait for the cohort to complete its cycle. Judge the new velocity only after that segment has had a full cycle window. A busy week of activity isn't evidence that the pipeline has improved. Compare the result with the original source and segment, then decide whether to keep the approach or change it.
Make the next decision from the weak input
If win rate is weak, tighten qualification and review whether the accounts show a credible buying reason. If cycle length is the problem, inspect dormant stages and the gaps between buyer-confirmed milestones before adding volume. If deal value is unrealistic, revise it to match what the team can reasonably expect to invoice.
Keep prospects that appear ready separate from broader matches. Record the buying signal's source and date. Treat a verified email or mobile as a contact check, not permission to contact someone or a forecast of revenue.
When the cohort has had time to move, keep the segment that produces healthier progression and conversion, and stop feeding the pipeline with names that only make it look bigger.
SignalVan identifies companies showing public buying signals, ranks prospects by the evidence and provides verified decision-maker contact details with draft outreach for review. Use those dated reasons to test which prospects move through the pipeline, while approving and sending campaigns yourself through your own Smartlead account. Visit SignalVan to see which prospects fit your offer and show a current reason to buy. Paste your website at signalvan.com to see who's ready to buy this week.
Keep reading

Prospect Rankings That Show Who to Contact
Prospect Rankings That Show Who to Contact
Approval Workflow Tools for Sales Outreach: 10 Compared
Approval Workflow Tools for Sales Outreach: 10 Compared

Email Address Verifications: What Each Result Means
Email Address Verifications: What Each Result Means
Start with your website.
See your first leads, with the reason each one is there.